See the full picture of your practice. Track revenue, monitor performance, analyze trends, and make data-driven decisions with real-time dashboards and comprehensive reports built into SightHub.
See every metric that matters — revenue, appointments, inventory, staff performance — in one unified dashboard.
Identify patterns in patient flow, sales, and operations before they become problems or opportunities you miss.
Stop pulling data manually. Automated reports run on schedule and land in your inbox ready to review.
Base your business decisions on real numbers, not gut feelings. Compare locations, providers, and time periods instantly.
Understand which services, products, and providers drive the most revenue and margin for your practice.
Dashboards update live as transactions happen. No waiting until end of day to see how the practice is doing.
From revenue and appointments to inventory and insurance — SightHub gives you the insights you need to run a smarter practice.
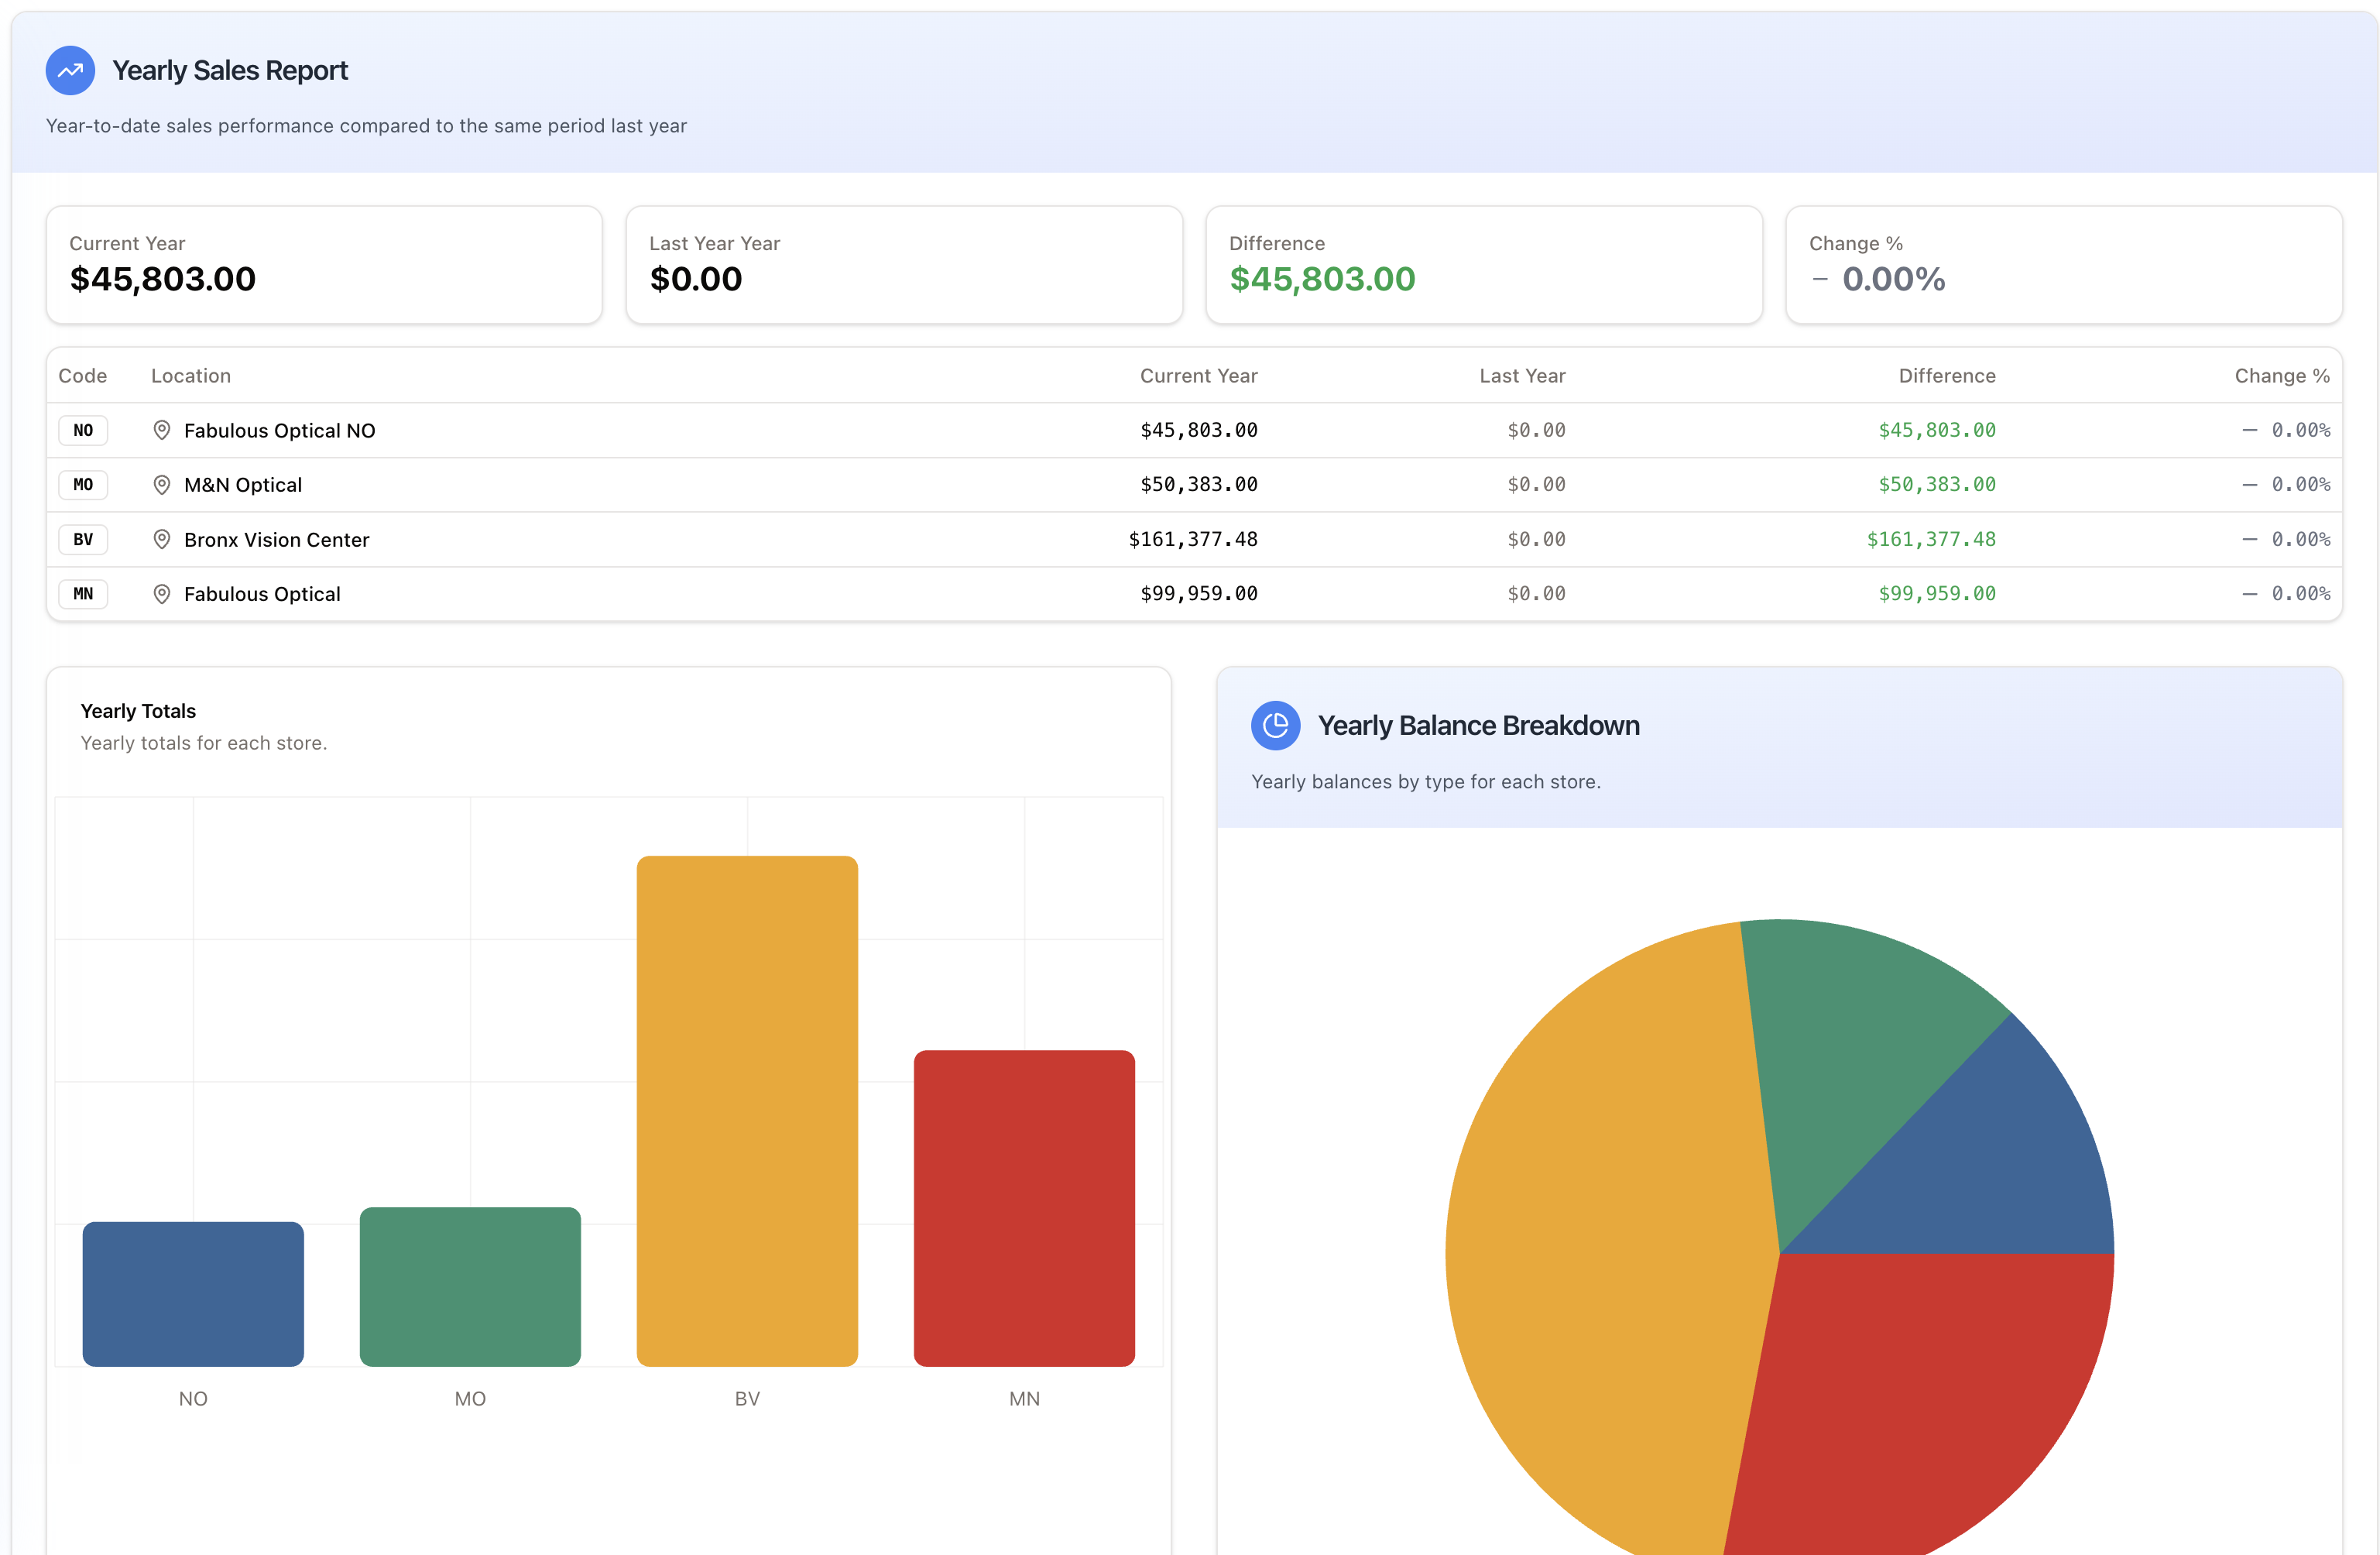
Track daily, weekly, monthly revenue by service, provider, location, and payment type. Spot trends and compare periods.
Monitor no-show rates, average visit duration, booking lead times, and appointment utilization by provider.
Track stock levels, turnover rates, best sellers, slow movers, and reorder alerts across all locations.
Understand your patient base — age, insurance mix, referral sources, recall compliance, and retention rates.
Monitor collections, outstanding balances, insurance aging, and payment method breakdown.
Track claim submission rates, denial reasons, reimbursement times, and payer performance.
Compare KPIs across locations side by side. Identify top performers and underperforming sites.
Build your own dashboards with the metrics you care about. Pin charts and KPIs for quick access.
Schedule reports to run automatically. Export to PDF, Excel, or CSV for external analysis.